✏ 공부
[Amplitude Foundations 1️⃣] Getting started with Amplitude Analytics
alwayshappydaysforever
2025. 3. 21. 19:28
반응형
- Explain how Amplitude's system can help drive product-led growth
- Navigate Analytics so that you know where to create charts and reports and where you'll administer Amplitude
- Explain how events and properties define your analysis
- Identify which chart types could meet your needs
- Build an Event Segmentation chart to analyze your users's product usage
Amplitude's Digital Analytics Platform
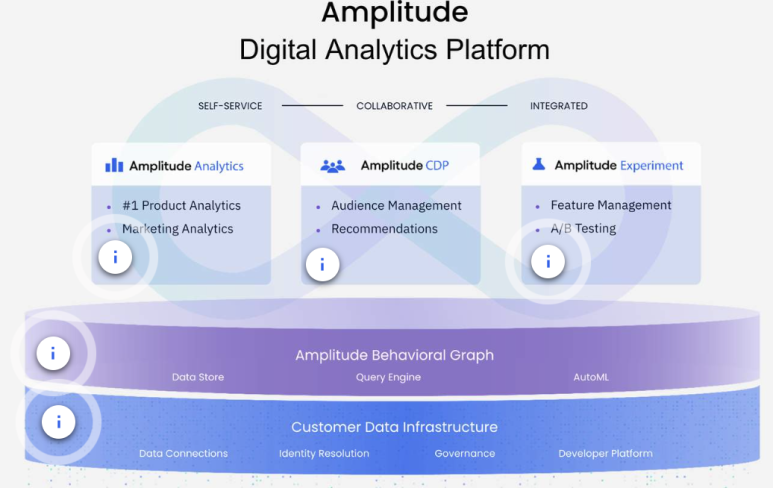
How does digital analytics drive business outcomes?
- Data Access & Insight
- Drive Business efficiency
- Build Loyalty
- Grow market share
Navigating the Amplitude Analytics UI

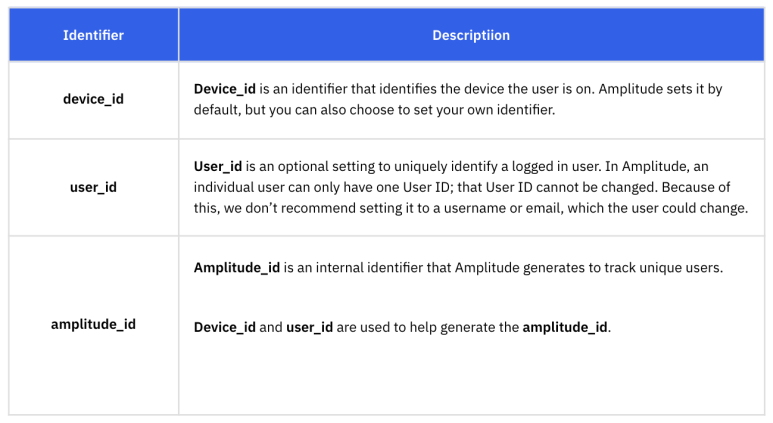
Amplitude's Event Data Structure

How Amplitude Identifies Users
Understanding who is a user depends on what data you're looking at. Amplitude uses three critical identifiers for processing a user. Take a moment to review the information from the video in the tabs below:
Customizing Out-of-the-box Insights
Amplitude takes the data you send in and visualizes it for you in charts based on the queries you enter.
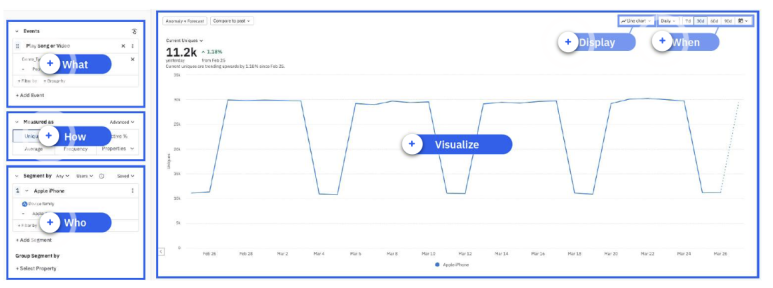
Core Chart Types
- Event Segmentation: For most users, Event Segmentation is the foundational Amplitude chart.
- Data Table: With Data Tables, you can add multiple events and metrics relevant to your product KPIs and quickly drill into segments that matter to you like country, product type, or plan type.
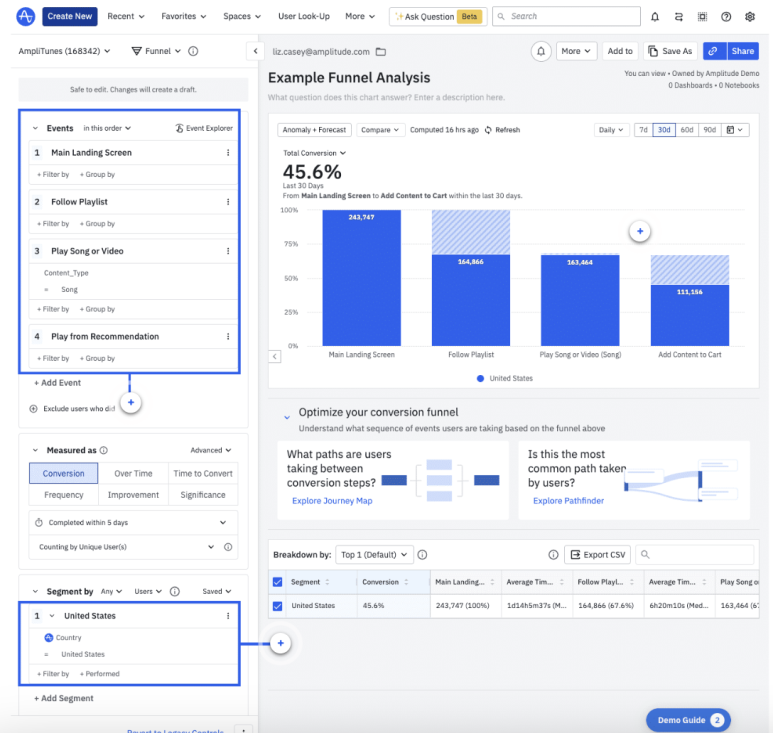
- Funnel: A funnel analysis chart helps you diagnose problems by seeing how users navigate a defined event path in your product.
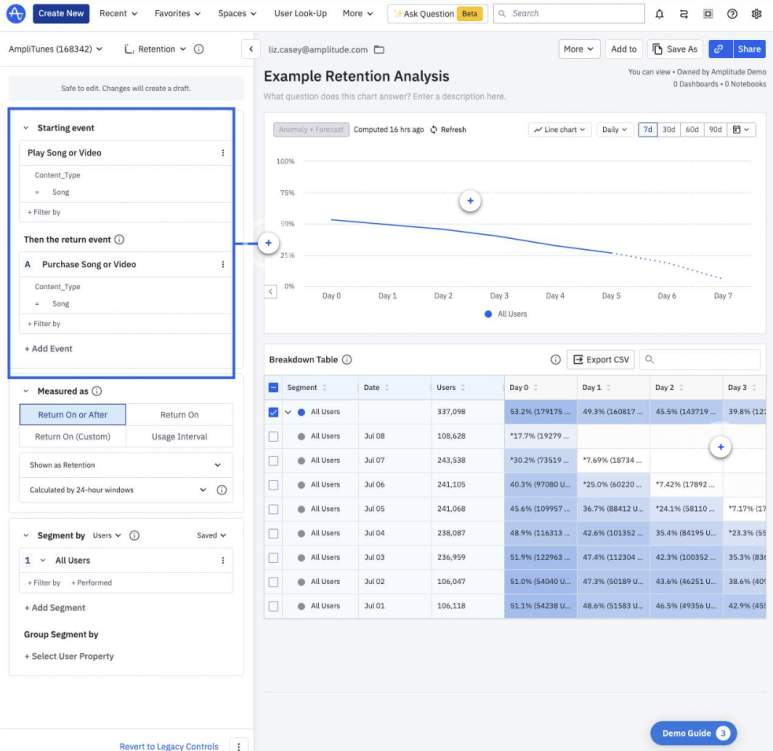
4. Retention: The Retention Analysis chart helps you drive product adoption by showing you the length of time between when users do two events. This is a great way to conduct A/B tests between cohorts (groups of users).
Amplitude's Collaboration Features
- Dashboards
- Notebooks
- Spaces

반응형